How to Effectively Find the IQR in 2025: Tips to Enhance Your Data Analysis
How to Find the IQR: A Comprehensive Guide for 2025
Understanding Quartiles and IQR
The **interquartile range (IQR)** is a fundamental concept in statistics that measures the variability of a dataset by focusing on the middle portion. This metric is crucial for analyzing data dispersion because it provides insight into the central tendency without being influenced by outliers. To grasp the full essence of the IQR, we first need to understand quartiles—a statistical measurement that divides data into four equal parts. The first quartile (Q1) marks the 25th percentile, while the third quartile (Q3) signifies the 75th percentile. The IQR is then calculated using the formula: **IQR = Q3 – Q1**. By exploring the IQR, we are effectively quantifying the range of the middle 50% of our dataset, a critical step in **data analysis** and understanding the **statistical spread**.
Defining Quartiles
Quartiles serve as key benchmarks in determining the distribution of data points. They are valuable in shaping analyses that rely on locating central values and identifying how data points spread within various ranges. The median, or the second quartile (Q2), divides the set into two halves. Quartiles are particularly significant when assessing measures like the IQR, wherein **finding Q1 and Q3** is essential to drawing accurate conclusions about **data variability**.
Calculating IQR Step by Step
To perform an **interquartile range calculation**, follow a step-by-step method. First, sort your dataset in ascending order. Next, identify Q1 and Q3—this can generally be done using statistical software, but for manual calculations, locating the 25th and 75th percentiles will suffice. Subtract Q1 from Q3 using the IQR formula to find the numerical range representing the spread of the middle 50% of data. This approach simplifies understanding and interpreting the core metrics surrounding the IQR in statistics.
Importance of IQR in Statistical Analysis
Why is the **IQR significant in statistics**? The interquartile range serves several important functions: it aids in **descriptive statistics**, acts as a tool for **outlier detection**, and allows for stronger decision-making based on the data set’s spread. Unlike the total range, the IQR remains resilient to extreme values, making it a superior choice for understanding the natural variability of your dataset. When comparing **IQRs of different datasets**, analysts can draw insightful conclusions about the data’s dispersion and central tendency while avoiding the bias that stem from unwanted extreme values.
IQR for Outlier Detection
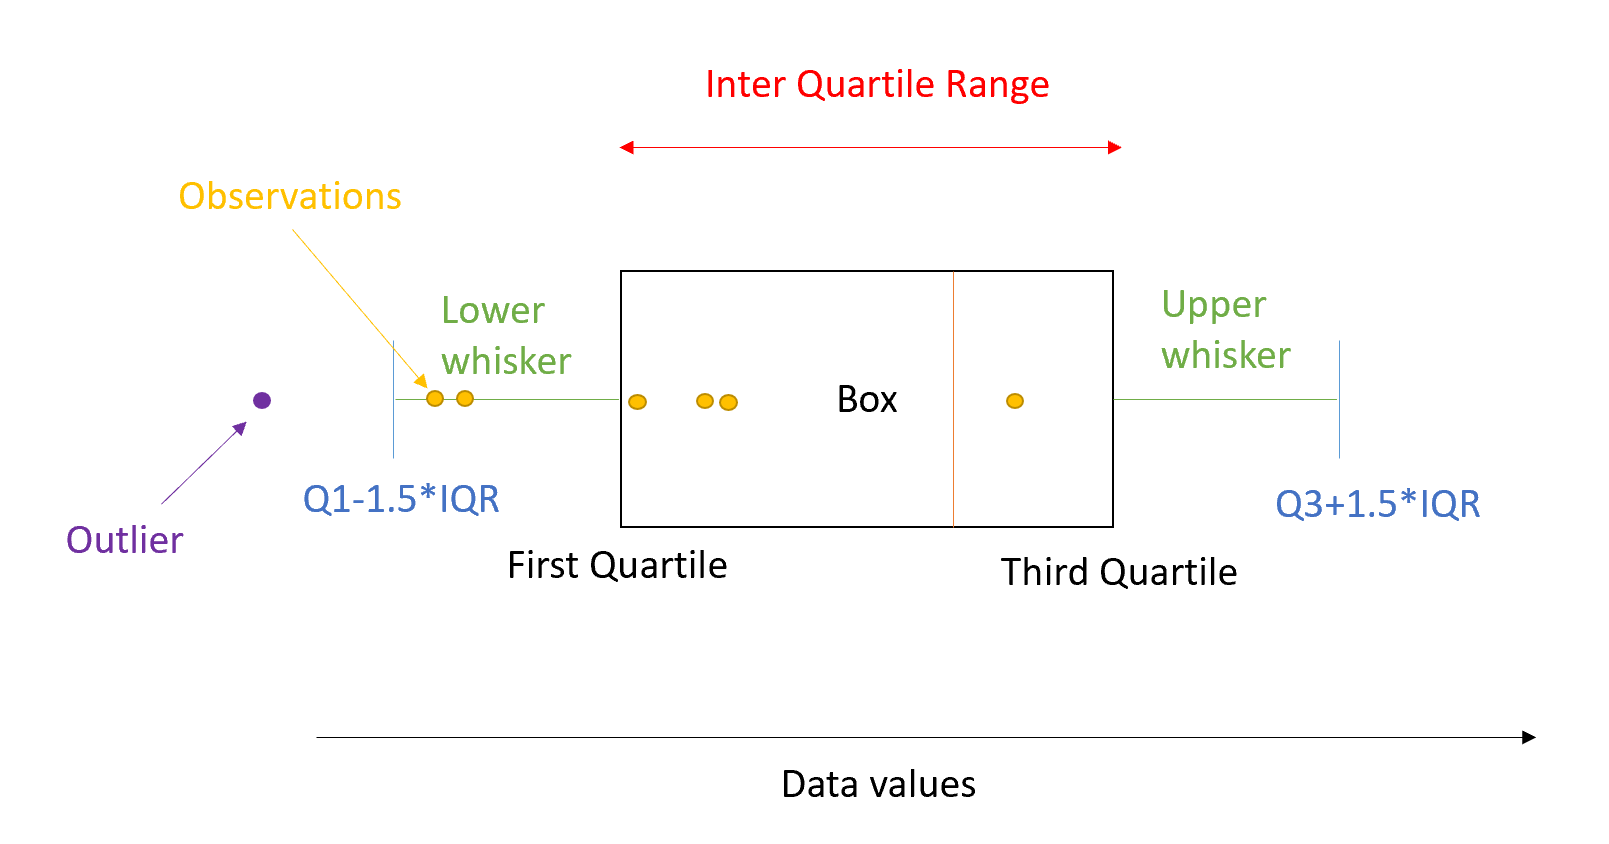
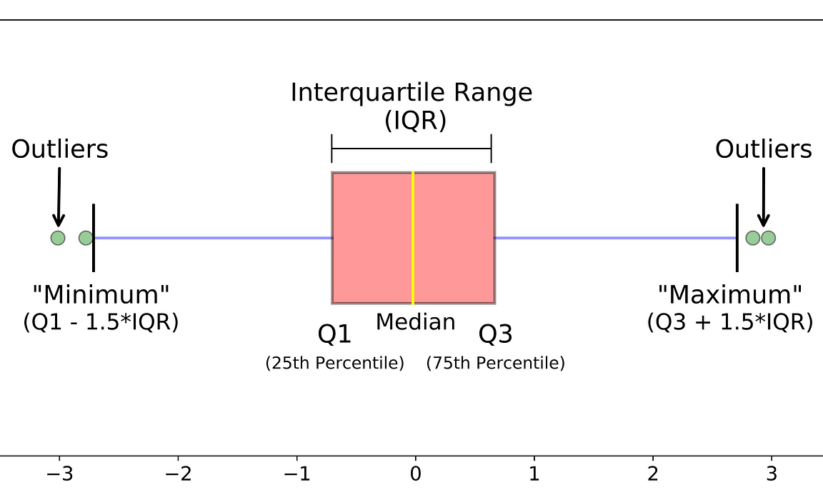
One of the primary applications of the IQR lies in identifying **outliers**. Outliers can skew data interpretation and mislead analyses. By employing the IQR, we can calculate the lower and upper inner fences, defined by **Q1 – 1.5 * IQR** and **Q3 + 1.5 * IQR**, respectively. Any data points outside these fences classify as outliers, aiding researchers in improving the reliability of their findings. This technique is prevalent in various fields, allowing for a more accurate portrayal of normal data distribution and enriching data interpretation.
IQR vs. Standard Deviation
Both the **IQR** and standard deviation measure data spread, but they do so in contrasting ways. The IQR focuses solely on the central data points—thus providing a clear understanding of dispersion within the middle range. On the other hand, standard deviation captures variability across the entire dataset, including extreme values. Understanding when to use each metric is essential for **data analysis methods**, ensuring precise approach selection for distinct statistical challenges.
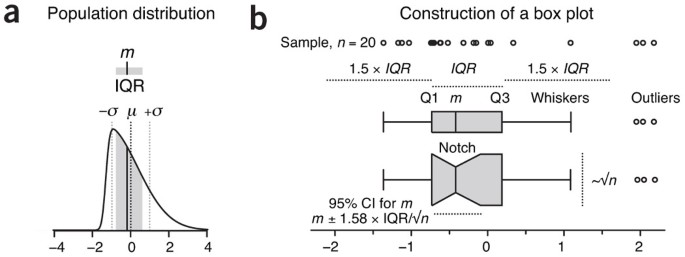
Visualizing IQR on Graphs
Visual representation is a powerful tool in statistics, enhancing understanding of datasets. The IQR can be visually interpreted through **box-and-whisker plots**, with the box representing the IQR, whiskers indicating the data range, and individual points marking potential outliers. By employing effective **data visualization techniques**, such as graphs illustrating the IQR, analysts enhance their ability to communicate complex datasets clearly and efficiently. This approach makes the information accessible, especially in educational contexts where data interpretation skills are crucial.
Applying IQR in Real Data Scenarios
In practical examples, applying the IQR can draw actionable insights from real-world datasets. For instance, if a researcher evaluates test scores, using the IQR allows them to understand the score distribution and identify any significant performance gaps. By summarizing key statistics, **IQR analysis** becomes a valuable asset in studying performance metrics and influencing educational evaluation processes.
Implementing IQR for Summary Statistics
Utilizing the IQR in summary statistics helps synthesize diverse datasets into quantifiable interpretations. The IQR provides a clear insight into how tightly clustered the data points are around the median. Through proper training in **IQR significance**, individuals can apply vital calculations that serve a broad array of fields—from education to research, facilitating outcomes driven by **data variability measurement**. Establishing proficiency in interpreting IQR enhances **students’ understanding of statistics** and allows researchers to produce reliable findings based on measured data.
Key Takeaways
- The **interquartile range (IQR)** is an essential statistical measure that demonstrates variability while mitigating the influence of outliers.
- Understanding how to find **quartiles** is key to utilizing the IQR effectively in data analysis.
- The IQR is invaluable for interpreting data distributions, fostering informed decision-making informed by statistical measures.
- **Visual aids** such as box plots enhance the understanding of the IQR while facilitating effective communication of data analysis.
- The application of IQR in practical scenarios enriches statistical methodologies across diverse fields.
FAQ
1. What is the definition of IQR?
The **IQR**, or interquartile range, measures data variability by reflecting the range within which the middle 50% of the data points fall. It is calculated by subtracting the first quartile (Q1) from the third quartile (Q3). This estimator is profound in highlighting the spread of the data without being impacted by outliers.
2. How is the IQR used in real-world applications?
The IQR is widely used across various domains, including education and research, for performance evaluation and outlier detection. By applying the IQR, analysts can gain a clear understanding of central tendency and variability, enabling more accurate conclusions about datasets.
3. What is the significance of IQR in education?
In the academic realm, grasping the concept of IQR is crucial for students learning **descriptive statistics**. It aids in understanding data variability and enhances their analytical skill set. The IQR can also be used to teach critical concepts such as outlier detection, empowering students with practical data analysis techniques.
4. How does IQR differ from standard deviation?
While both the IQR and standard deviation measure a dataset’s variability, they differ fundamentally. The IQR assesses central data dispersion, whereas standard deviation considers the entire dataset, including extreme values. Selecting the appropriate measure depends on the distribution characteristics and analysis goals.
5. Are there effective tools for calculating IQR quickly?
Yes, various statistical software and online calculators can perform quick IQR calculations using your dataset. Additionally, educators can introduce students to software-based solutions that simplify calculations and visualizations, ultimately improving their comprehension of data analysis techniques.
6. Can IQR be visualized easily?
Absolutely! The IQR is frequently visualized through **box-and-whisker plots**, which clearly illustrate the median, quartiles, and outliers in a dataset. This visual representation can significantly enhance comprehension and facilitate better communication of data results.
7. What resources can I use to learn more about IQR?
Several educational resources are available to enhance your knowledge of IQR, ranging from online tutorials to worksheets and teaching aids. Websites focusing on statistics education often provide detailed guides and practical applications for learners to practice and reinforce their IQR understanding.