Simple Guide to Finding the Interquartile Range: Enhance Your Data Analysis Skills in 2025
“`html
Simple Guide to Finding the Interquartile Range
Understanding the interquartile range (IQR) is essential for enhancing your data analysis skills, particularly in 2025 as data-driven decision-making continues to evolve. The IQR offers a powerful way to summarize a data set’s variability and detect outliers, allowing statisticians and data scientists to make informed decisions. In this guide, we will break down the IQR definition, illustrate how to calculate IQR, explore its significance, and demonstrate practical methods for utilizing the interquartile range in data interpretation.
IQR Definition and Calculation
The interquartile range is a measure of statistical dispersion that represents the middle 50% of a data set. It is computed by finding the difference between the upper quartile (Q3) and the lower quartile (Q1). Understanding how to find IQR involves several steps in quartile calculations. Begin by organizing your data set in ascending order, then identify Q1 and Q3. The IQR is calculated using the formula: IQR = Q3 – Q1. This method illustrates the data spread while minimizing the impact of outliers.
Calculating Quartiles
To accurately calculate the quartiles, follow these steps:
- Order your data set from smallest to largest.
- Find Q1, the median of the first half of the data set.
- Locate Q3, the median of the second half of the data set.
- Apply the IQR formula: IQR = Q3 – Q1.
For instance, consider the following data set: 3, 7, 8, 12, 14, 17, 18, 21, 25. The first step is to find Q1, which is 8 and Q3 is 18. The result gives us an IQR of 10, illustrating a focused look into the dataset’s central values.
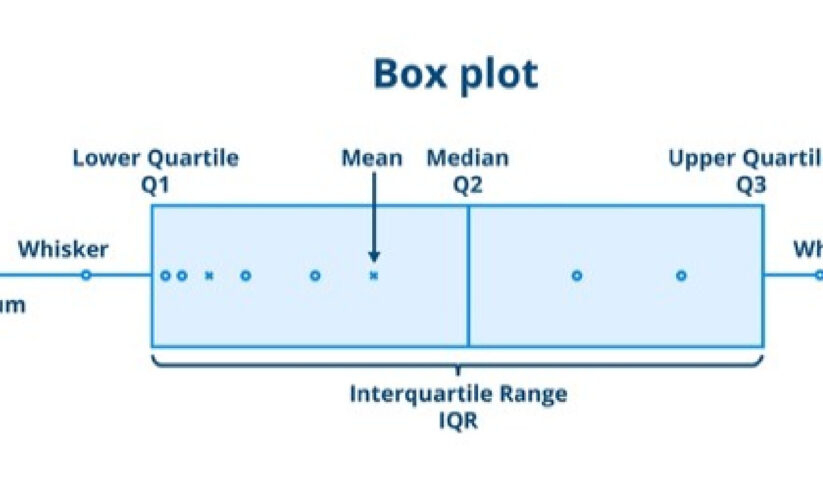
IQR in Box Plots
The interquartile range is prominently utilized in box plots, which visually depict summary statistics of data sets. Box plots consist of a box that spans from Q1 to Q3, with a line at the median for easy interpretation. Additionally, whiskers can extend to the smallest and largest values within 1.5 times the IQR beyond the quartiles, thus potentially marking outliers. Using a box and whisker plot not only simplifies the representation but also highlights the importance of IQR in identifying variabilities and outliers.
Importance of IQR in Data Analysis
The significance of the interquartile range in statistical analysis cannot be overstated. Firstly, it provides a robust understanding of data variability, enabling professionals to make more reliable conclusions based on data insights. The IQR is particularly useful in determining whether data points are outliers, making it invaluable for effective data interpretation and outlier analysis.
IQR Significance for Outlier Detection
Using IQR for outlier detection involves identifying values that lie beyond the typical interquartile range. The formula commonly employed is: Any data point below Q1 – 1.5 * IQR or above Q3 + 1.5 * IQR is considered an outlier. For statistical data analysis, recognizing these outliers is crucial, as they can skew results significantly. For instance, if our earlier example data set has an additional outlier value of 100, the calculated IQR will remain unchanged, but interpreting the data set’s overall context requires acknowledgment of this outlier.
Statistical Measures: Variability and Central Tendency
The connection between the interquartile range and measures of central tendency like mean and median enhances the analysis of variability. While IQR focuses on spread, mean and median allow for a balanced perspective on data sets, collectively contributing to a rounded understanding of data behavior. This combination ultimately impacts data interpretation, yielding critical insights into trends, central points, and deviations within various statistics.
Practical Applications of IQR
The IQR in statistics has numerous applications beyond basic calculations; it’s a cornerstone in fields like data science and research. Recognizing how to effectively use IQR in research assists in evaluating data integrity and enhancing models for predictive analytics. Understanding the facets of IQR can empower professionals to make data-informed decisions across various industries, whether in health care, finance, or technology.
IQR in Data Science Best Practices
In data science, employing the IQR method helps in the preprocessing of data for machine learning models. High-quality predictions rely on clean datasets; thus, removing outliers identified by the IQR method refines model performance dramatically. Additionally, exploring data distributions through advanced statistical techniques strengthens the integrity of analyses and ensures accuracy in decision-making influenced by data.
Data interpretation Frameworks
Building effective data interpretation frameworks requires integrating IQR insights as part of broader analytical efforts. Establishing methodologies for addressing variability informs businesses on behavior trends and guides strategic initiatives. Organizations leveraging IQR frameworks are better equipped to tackle critical challenges such as forecasting and resource allocation, ultimately driving success.
Key Takeaways
- The interquartile range is a measure of statistical dispersion that focuses on the middle 50% of data.
- Finding quartiles is crucial for determining the IQR and identifying outliers within a data set.
- Box plots serve as a practical application of IQR, providing visual insights into data distributions.
- Understanding the significance of IQR enhances data analysis skills critical for various fields.
- Utilizing IQR effectively can greatly improve the accuracy and efficiency of data-driven decisions.
FAQ
1. What is IQR in statistics?
The IQR in statistics is defined as the range between the first (Q1) and third (Q3) quartiles, summarizing the middle spread of data values. It specifically highlights the central 50% of a dataset, eliminating the influence of outliers.
2. How do I calculate the interquartile range?
To calculate IQR, organize your data in ascending order, identify Q1 (the median of the lower half) and Q3 (the median of the upper half), and subtract: IQR = Q3 – Q1. This method gives insight into the data’s variability and central tendency.
3. Why is IQR important in data analysis?
Understanding the importance of IQR in data analysis lies in its ability to summarize variability accurately while identifying outliers. It provides researchers and analysts reliable insights into data distributions, which is critical for informed decision-making.
4. How does IQR relate to outlier detection?
In outlier detection, any data point that lies outside the range of Q1 – 1.5 * IQR and Q3 + 1.5 * IQR can be considered an outlier. This characteristic makes IQR especially valuable for ensuring that data interpretations remain robust and uncontaminated by extreme values.
5. Can you give an example of using IQR?
An example of using the IQR method could involve a data set reflecting exam scores. After calculating Q1 and Q3, you derive an IQR that highlights performance ranges and flags any outliers that require further investigation or action.
“`